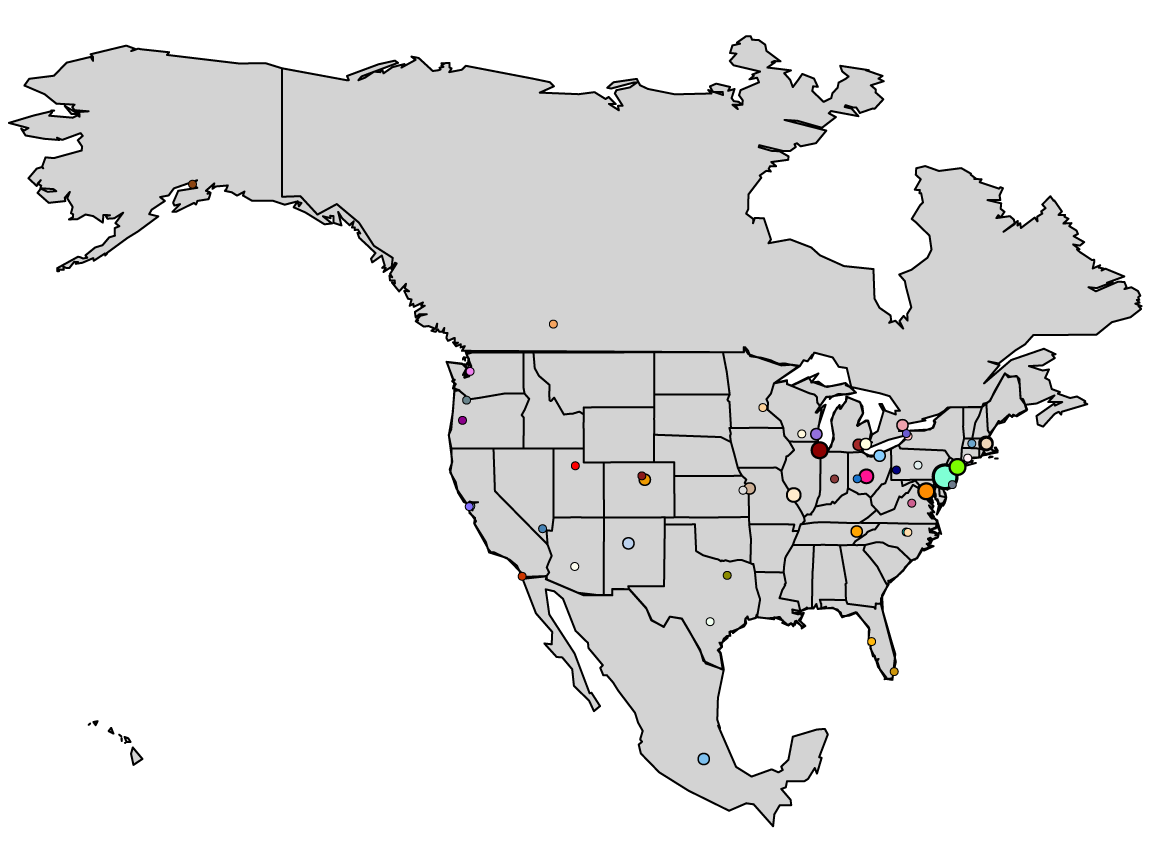
The annual meeting of the American Association of Physical Anthropologists (AAPA) takes place in Knoxville, Tennessee in 2013. After checking the website, I saw that the AAPA keeps a list of past meeting locations, among other things. How often have the meetings been held in different cities? I made a map to help out.
First, I had to capture the data from the PDF file on the AAPA website, then separate out the years and cities using regular expressions. The data table only specifies city names, so I had to use some judgment in classifying which US state (or North American country) the meeting took place in. This was relatively straightforward, as most meetings take place in big cities or well-known college towns. I then pulled geographic coordinates from each city’s Wikipedia entry.
The resulting tab-separated text file is available for download here. All cities up to 2015 (St. Louis) are included. The resulting map and the R code for generating it are below:
aapas <- read.table('aapas.txt',header=TRUE,sep='\t')

cities <- data.frame(city=names(table(aapas$city)),
   n=as.numeric(table(aapas$city)))

xy <- aapas[c('city','long','lat')]

cities <- unique(merge(cities,xy,by='city'))

## order cities so that biggest circles are plotted first
cities <- cities[order(cities$n,decreasing=TRUE),]

## choose from non-gray colors
cols <- colors()[-c(grep('grey',colors()),grep('gray',colors()))]

## match exact polygons to avoid over-expanding the map extent
polygons <- c('USA','USA:Alaska','Hawaii:Nihau','Hawaii:Kauai',
   'Hawaii:Oahu','Hawaii:Molokai','Hawaii:Lanai','Hawaii:Maui',
   'Hawaii:Kahoolawe','Hawaii:Hawaii','Canada','Mexico')

library(maps)

map(regions=polygons,exact=TRUE,fill=TRUE,col='lightgray')
map('state',add=TRUE)

## circle areas are proportionate to number of meetings
points(cities$long,cities$lat,pch=21,cex=sqrt(cities$n/pi),
   lwd=sqrt(cities$n/pi),bg=sample(cols,nrow(cities)))


 RSS
RSS